An Analysis of Presidential Elections
May 26 2007 Sat
1:21 pm PHT
If you understand the title, then it sounds intuitive doesn’t it? If you have a plurality elections (like what we have here in the Philippines), then the more candidates there are, the lower the probability of the winner getting the majority votes. To interpret that in another way and to put it into statistical terms, there is an inverse correlation between the number of candidates and the percentage of votes that the winning candidate gets.
So I read Manolo’s post pointing to an analysis by Sass Rogando-Sasot regarding the past Philippine presidential elections from 1935 to 2004. Apparently, that intuitive statement I mentioned earlier does not work in our elections. The inverse correlation is very weak because Marcos managed to win the 1965 and 1969 elections with a commanding majority (52% and 62% respectively) despite running against 11 other candidates in both elections! If you’re a relatively new voter, that’s unheard of. Estrada, the masa candidate, only managed 40% against 10 others. (You really need to read or at least scan Sass’ post to put my article into context.)
Because of this weak correlation, Sass argues that there must be really something wrong with our political system in the last three presidential elections because we don’t manage to elect a majority president. The problem is that it’s supposedly impossible to run a country if majority of voters don’t really like you for president.
Well, first of all, just because someone voted for Miriam Santiago doesn’t necessarily mean that that person doesn’t want Fidel Ramos to be president. It does not follow. That vote just means that the voter considers Santiago to be the best person for the job. There’s nothing there at all to say whether the voter thinks Ramos is good or bad as president.
Secondly, for the correlation analysis, I would argue that instead of the 1992, 1998, and 2004 elections being statistical anomalies, I think that it’s the 1965 and 1969 elections that are the real anomalies. Looking at the 1965 and 1969 elections, we find out that almost all of the 12 candidates in both elections could be considered as nuisance candidates. In the former, the top 3 candidates got 99.99% of the votes while in the latter, the top 2 candidates got 99.98%. Now there’s your statistical anomaly!
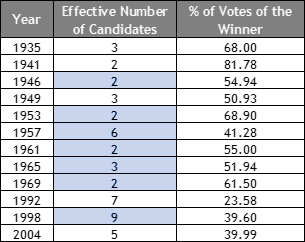
So let’s try the analysis again ignoring these weird candidates. Shown below is the revised table of presidential election results with the number of candidates reduced to the serious ones based on the votes they received. The highlighted number of candidates are the reduced values. (You may disagree with the exact value of reduction but I think the conclusion would still be the same.)
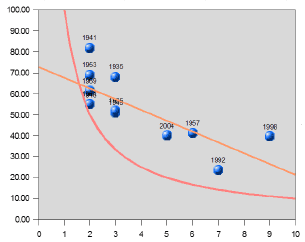
If we graph the data in a scatter plot and draw the linear regression (orange line), the magical intuitive negative correlation appears! (The pink line is the equal distribution curve—what each candidate would get if the votes were equally distributed.)
I don’t have to compute any correlation coefficients (I’m not a stats major) to show that the negative correlation is now stronger. Looking at the graph above, we can now conclude that Erap really was an exceptionally strong candidate and that FVR had too much competition. We also see that Manolo’s grandpa’s victory in 1941 is clearly the best presidential victory of all time (and unprecedented because it was a second-term win).


Comments
Comments are currently disabled.